Magento is a platform of epic proportions. With countless lines of code and functionalities, it is unsurprising that things tend to get bogged down, as a result of overlapping and unoptimized code. Because of this, the user experience tends to suffer in light of the decreased performance speed and people like us, working with Magento, do what they can to optimize what can be optimized.
Fully aware of this, Magento includes cache management functionalities as well as a flattables database with their systems, however, even with these two things working perfectly, we often encounter situations when specific pages still take too long to load. This means that even in those cases, which on the surface might seem perfect, further improvements can be and should be made.
The Problem: Unoptimized Code
The source of the problem can be twofold. Either a) the code itself isn’t sufficiently optimized — a lot of fat should be trimmed, or; b) the load generated by the code on the databases is too overwhelming, meaning that it doesn’t have enough resources to deal with requests rapidly enough.
How To Deal With This?
Slow logs are sometimes used for tracking down the slowest operations and are a built-in feature for many services, like PHP-FPM, MySQL, etc.. A customizable analyzer, it gives the option to view operations that are too time- consuming, i.e. you can track all operations that take longer than 10 seconds and this time variable is easily customizable.
It’s a hassle to use it though — it’s sometimes hard to replicate the errors; it also takes a lot of time to simply analyze the whole thing and hence find the specific cause of the troubles. All in all, it takes too much effort and the results produced aren’t always what you’re looking for.
Profilers
Xdebug
Lately, we’ve been starting to use profilers. For one project we used XDebug. While it got the job done, it was still a troublesome endeavor, as the graphs produced were crowded, difficult to read and analyze and simply not clear enough. The results also required additional, quite dated software to view, resulting in a non-convenient, and even occasionally hard-to-understand information.
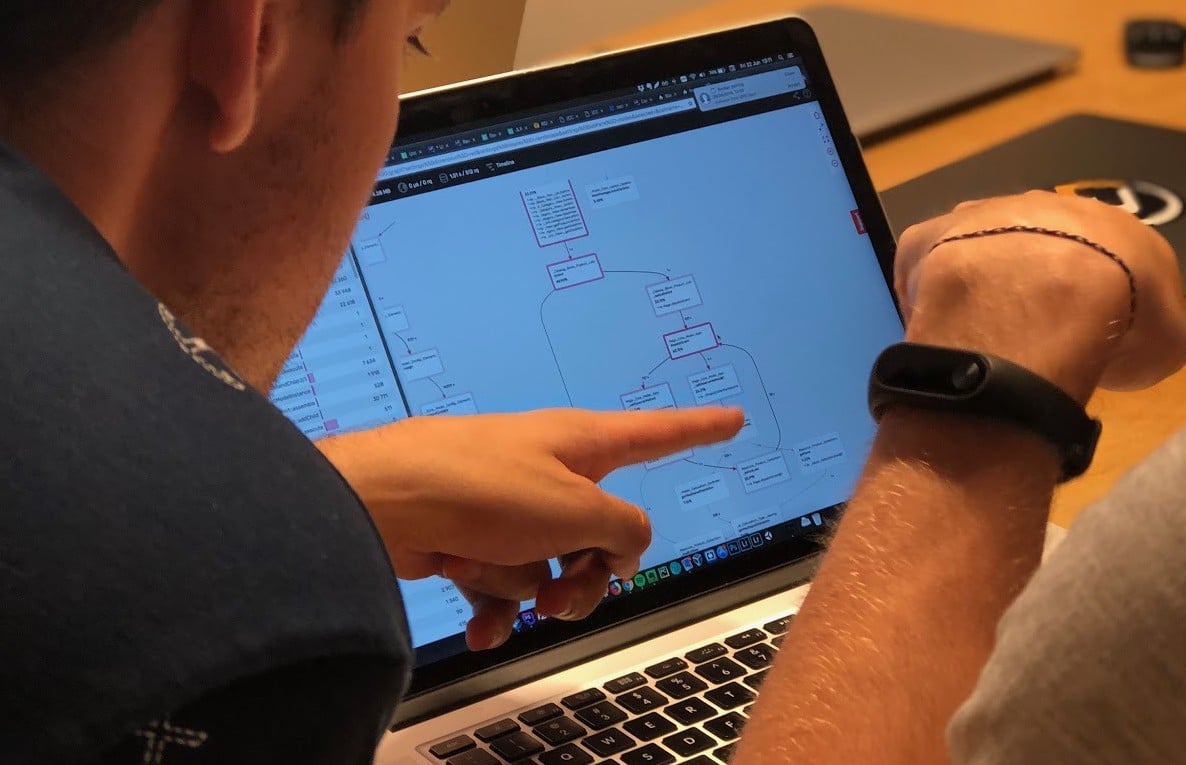
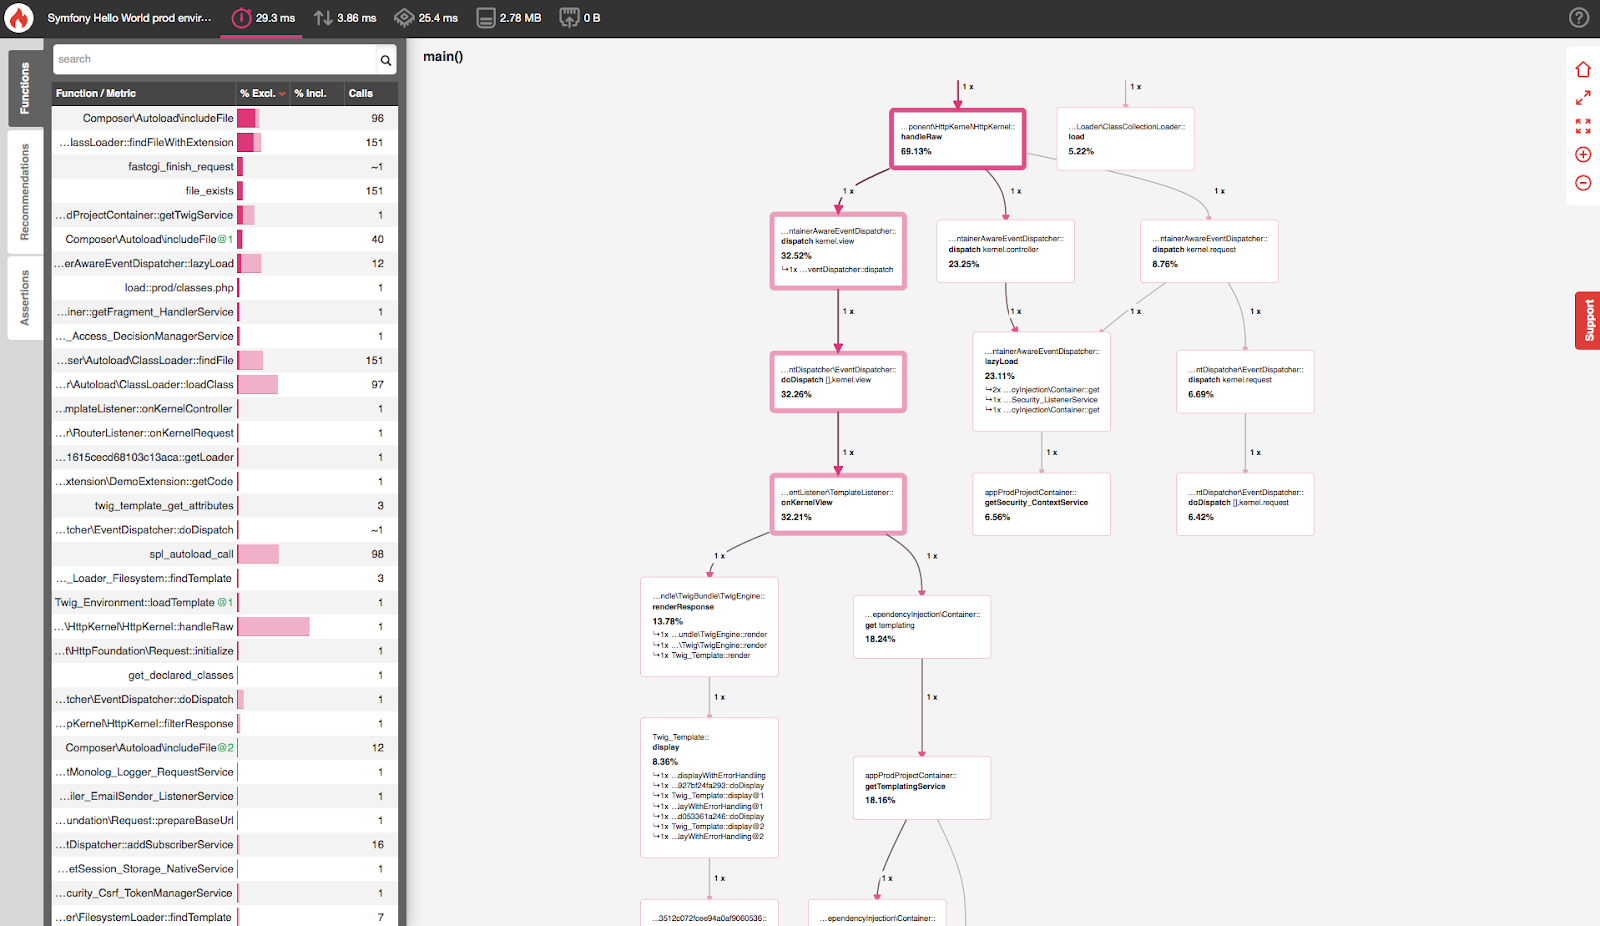
Blackfire
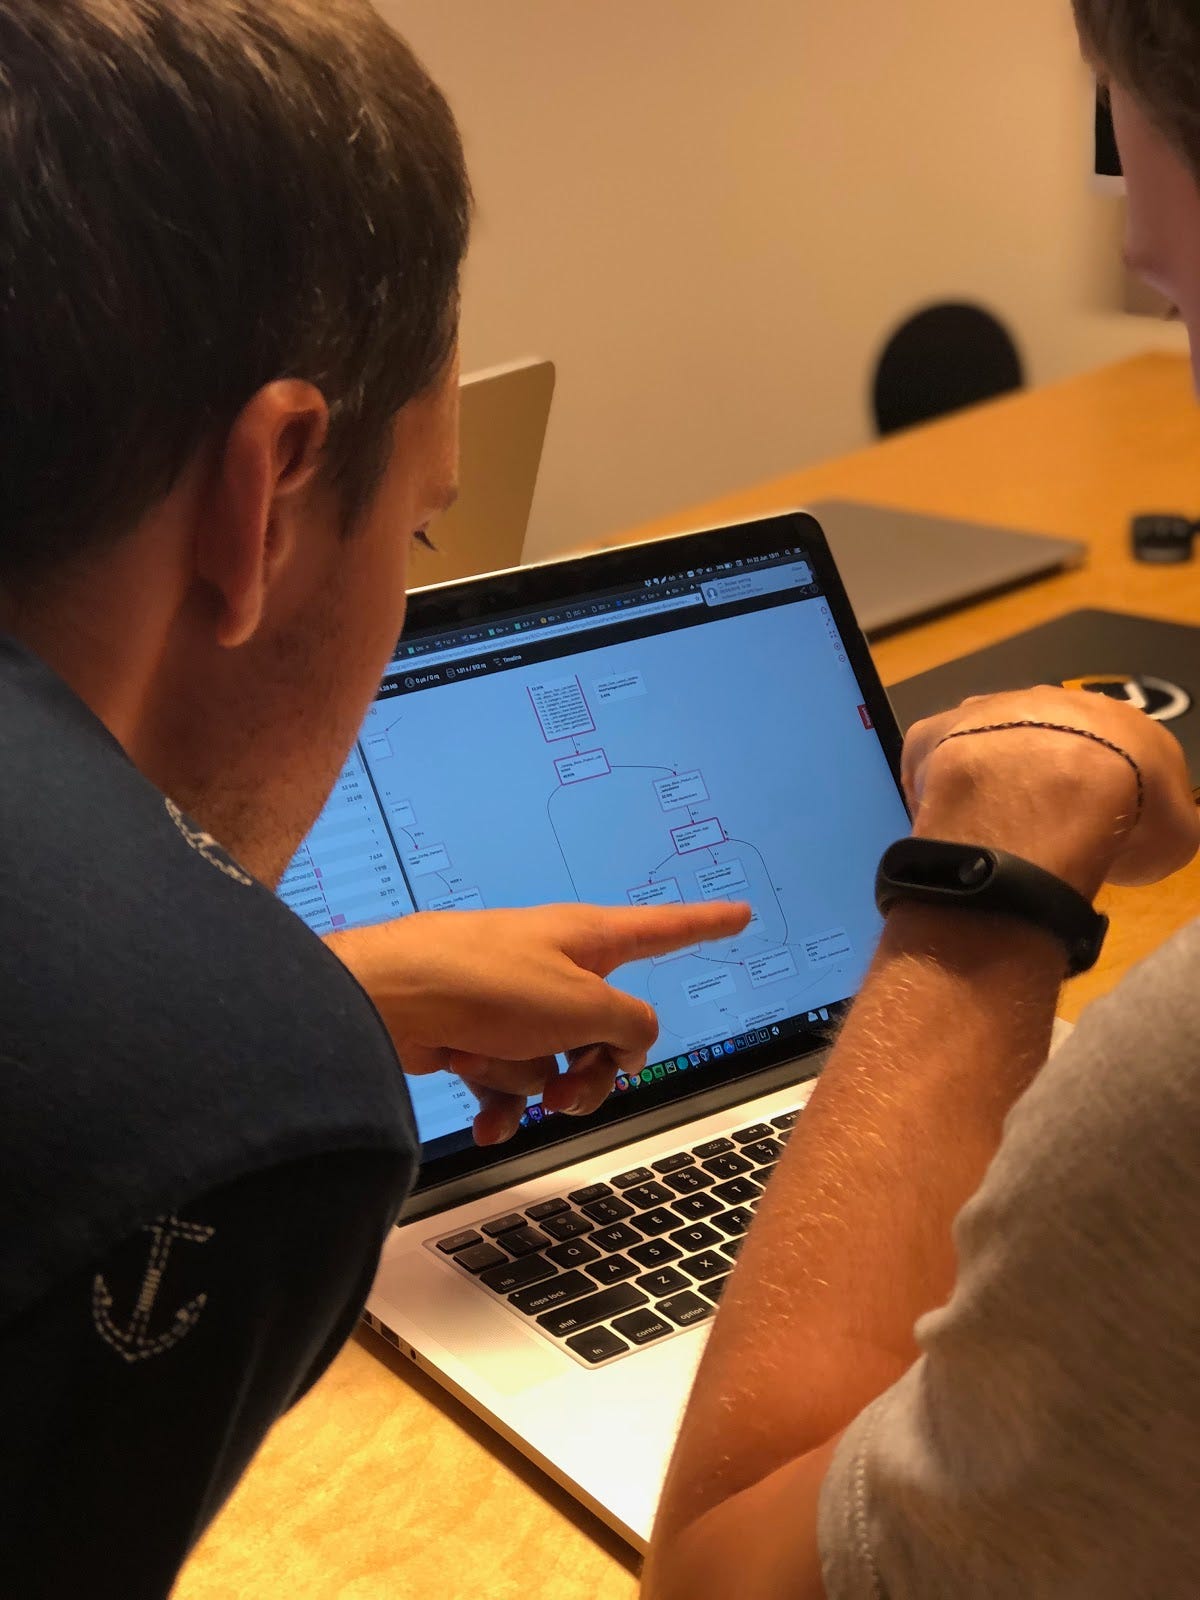
Unhappy with the tool, but happy with the results, we decided to try a different profiler — Blackfire. Blackfire tracks all activity in terms of work with the database — it shows numbers and types of database queries; it creates great schemes displaying links and connections of what’s happening in the code. It gives a good overview of how things are working and how long they take. Furthermore, installing such a module is quick and effortless.
Another benefit is the ability to use it in production for specific requests which come from us, meaning it doesn’t affect other users and clients won’t notice.
Case #1: By using Blackfire we found a third party extension that worked inefficiently with the data (asked for too much data, too frequently), and changing a small bit of code, reduced the page loading times by over half – 12–15s -> 6s in the test environment!
Case #2: On a different project, we had a problem in that the category page would take a long time to load. Using Blackfire, we found that there were over 950 queries. We could see where they were coming from and then in correcting 3 lines of codes, we reduced the query count by half!
To Sum Up
A profiler is a handy tool when there are problems with performance. Even if you believe that you know where the problems are, you can still get lost in quantity and layers. Use a profiler, rather than guess at the problem — spend a couple of hours with it, analyze the results and then critical factors will be found, where, with targeted work, a lot of time in terms of performance can be reconquered.
Any questions or comments? Or maybe you’re curious about what Scandiweb can do for you? Let us know at [email protected].
Related articles:
MySQL Database Memory Optimization

Share on: