Dive with us into some custom setups for Google Data Studio! Learn how to set up Data Blending and Custom Metrics.
In this article, we will guide you through a simple 5 step process to apply data blending to scorecard portraying sessions in order to help you segment them. In addition we’ll show an example on how data blending in Google Data Studio helps to create a drop-off metric in checkout funnel.
On July 12, 2018, Google Data Studio introduced a new functionality — data blending — which allows blending data from multiple data sources. For data analysts, this means new opportunities to find more user behaviour insights which translate to valuable improvements, whether the main task is to improve the overall digital marketing strategy or just a specific part of it.
As the main task of my team is to increase conversion rate related to the purchasing process, I used to think that the data blending is a nice feature to have, however, there are many other functionalities Google should work on.
For example, I didn’t see that much advantage of blending Google Analytics and Google AdWords (or any other data source) because, with some effort, it could be done via Spreadsheets. Instead, I would’ve been more thankful to Google if they would implement some functionality that allows making custom calculations when different segments are applied.
Recently, my attitude changed — with help from other Google Data Studio admirers I found out that by using exact data blending functionalities it is possible to do the calculations I want. In the next paragraphs, I’ll demonstrate how to make custom calculations with different segments and share some examples of where data blending can be useful.
Google Data Studio Data Blending Example
Data blending when one of the metrics in the formula represents a segment
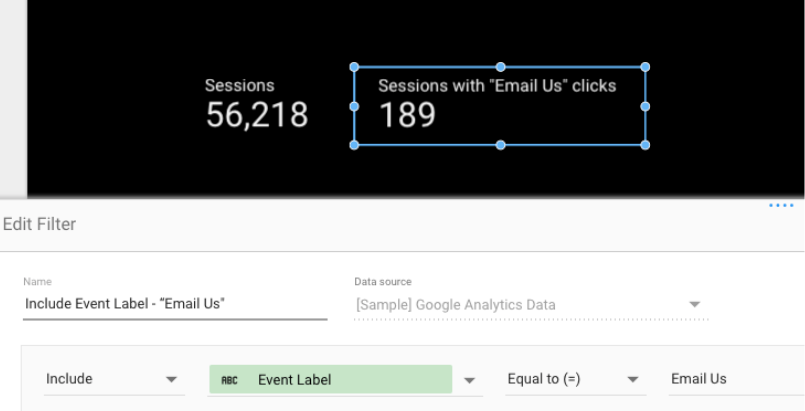
Let’s imagine that we should calculate the percentage of sessions where users have clicked on the “Email Us” button.
To track clicks custom event is previously made (Event Label — Email Us).
Steps to take:
- Create a scorecard with all Sessions (standard metric in GA)
- Create a scorecard with Sessions + create and apply filter “Include Sessions when Event Label Equals “Email Us”.

- Change the name of scorecards so you would know which scorecard/metric represents what data.
- Mark both scorecards and with right click on mouse open the settings list and click on “Blend data”.
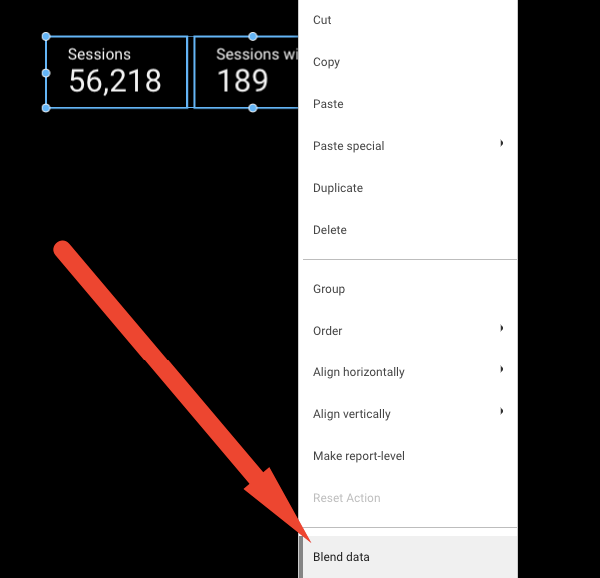
The settings list in Google Data Studio
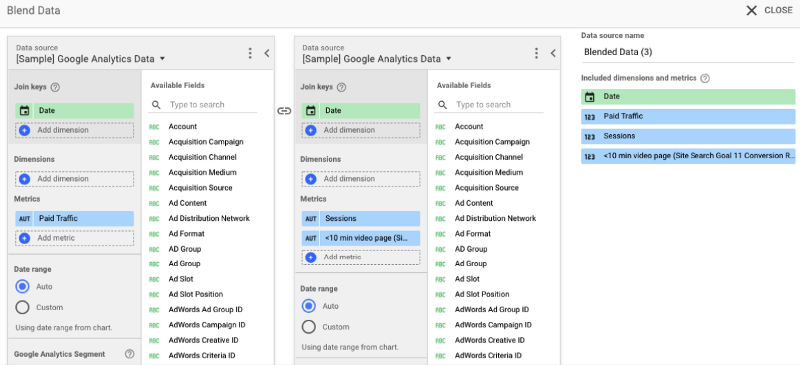
By this, you have created a new scorecard and a new data source — Blended Data (1) with only 2 metrics.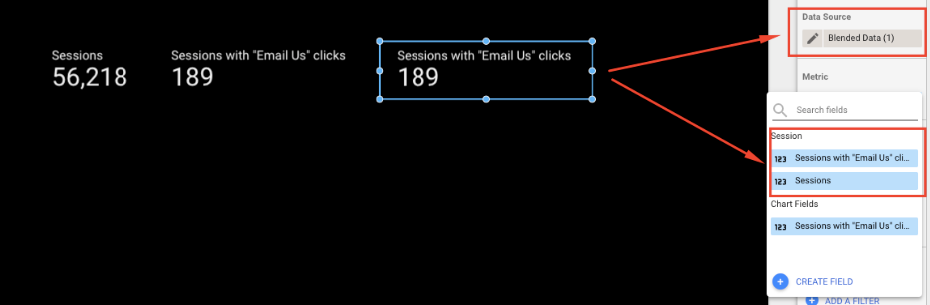
New data source and new metrics
- Create a new custom metric by using specific metrics you created when blending the data.

Congratulations — you have made a custom metric with a specific segment!
Keep in mind that data blending can also be helpful without making extra calculations. For example, digital marketing specialists might be interested to see the time series chart with “All Sessions” and “Sessions from Paid channels”.
To do this, follow the same steps — create two separate charts, apply correct segments, rename them and in the third chart you’ll see one common chart.
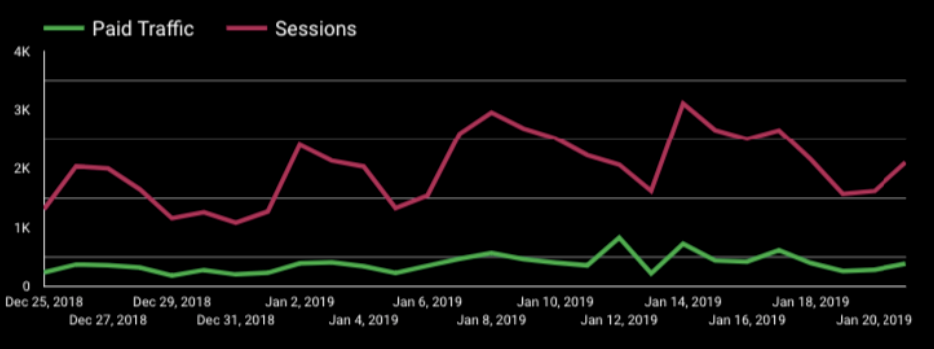 All Sessions vs Paid Traffic
Google Data Studio Data Blending Example
Fully automated shopping and checkout behaviour funnel
Another great way how to use the Google Data Studio data blending functionality is when building automated Shopping and Checkout Behaviour Funnels.
Approximately a year ago, a big discovery was the “Shopping stage” dimension that allowed to build the funnel itself. However, in order to calculate drop-off rates, we needed to use Spreadsheets and Add-ons and that took more time than desired.
Now, Google Data Studio data blending allows us to fully automate the process. What’s more, it not only saves our time but also lets us share reports with clients without worries about whether they’ll know how to refresh the data.
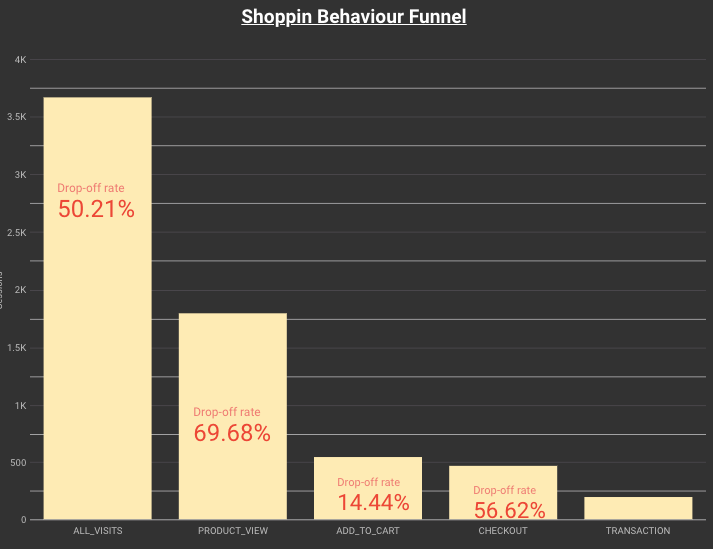
Shopping Behaviour Funnel
To create a drop-off metric in the shopping or checkout funnel, follow the same steps described in the first example. Only this time both initial scorecards will have segments applied, therefore it is even more important to rename both of the metrics.
I hope that examples shared will help you to find more interesting data insights to play with and develop. If you have any thoughts or suggestions, comment below or write to us at [email protected]!
Need help with tracking and measuring your eCommerce store’s performance? Learn more about our analytics services and how we can work together to improve your eCommerce site!
Related articles:

Share on: