Background
We have developed a Laravel application from the ground up to handle ICOs (Initial Coin Offerings) as easily as possible.
From customer perspective, it’s straightforward:
- Sign up for the ICO and wait for the invitation email which get processed in automatic batches
- Accept the terms of sale and enter your Bitcoin and Ethereum wallet information
- Receive system-generated Ethereum/Bitcoin wallet addresses to send your funds to and check the transaction status of these addresses right from the page
Due to the nature of ICOs, it’s first come — first served. Because of this, the largest user influx in the very beginning of the sale.
On our latest sale we had direct data that 30,000 people are interested and are very likely to participate in the sale when it goes live, in result our Queue Service was holding 40,000 people waiting in the que to participate. Queue is managed in regard to personal caps, total cap and ETH blockchain load status to avoid congestion experienced in several ICOs, when none of the payments could pass through.
Task
- Simulate 30,000 people directly participating in the ICO, while imitating a realistic user journey
- Based on the results adjust the infrastructure to improve load handling and achieve error-free support of 30,000 concurrent users
- Document the results
Methodology
1. Planning the testing scenarios
Before you can proceed with any testing, it is important to actually understand what and why you are testing. Simply pushing some load to a page will almost certainly not represent a real life scenario and ultimately can turn out to be useless.
Our application is fairly simple from a visitor’s perspective, hence the scenarios are simple.
Think like a user who has never seen the page before! If possible, get another human being to go through the whole application flow.
First scenario — user registration
The first touching point of our application is the registration page.
When a visitor enters his email, he is put in a queue, which is automatically processed and the queue position is reported to the user every 30 seconds.
Here’s a GIF depicting that:

What we see here are 2 one-time actions and 1 continuous action
- Entering the email
- Submitting the form
- Continuously polling the position from the server
Seems simple, however you have to also mind what is going on in the server in addition to simply serving HTTP requests. In our case
- Database inserts for the new users
- Database read operations for position getting
- Sending the user information to the queue (AWS SQS in our case)
- Running a process that sends out queue emails
Now we can precisely define our scenario
- User makes a GET request to open up the index page
- User enters his e-mail and submits the form, creating a POST request
- User keeps monitoring his position by issuing a GET request to the position API endpoint every 30 seconds. Let’s assume that the user will not stay on the page longer than 5 minutes just staring at his position, so we limit these requests to 10 per user.
Second scenario — user journey completion
Now, when the user has received his email, he can proceed with the 3 final steps of the application:
- Accepting the terms of sale
- Filling out his address information
- Receiving system-generated addresses for depositing funds
Here’s a GIF depicting that:
As you can see, this involves more actions from user perspective, so we can define our load testing scenario:
- User makes a GET request to his generated URL, initially consisting of Terms of Sale page
- User makes a POST request accepting these terms of sale. Let’s do this after a period of 3–5 seconds, which is a realistic estimate of somebody having to orient himself to the Accept button
- User gets redirected to the wallet information page and after 3–5 seconds makes a second POST request submitting his wallet information by filling out all the fields
- User gets redirected to payment information page and stays there to monitor his payment status.
This is done by issuing a GET request every 30 seconds to the payment status API endpoint.
Once again let’s assume that the users will not stay here for longer than 5 minutes.
2. Implementing the testing scenarios
When the plan is set, we just need to translate it to an actual test.
For this, Gatling was used. It’s an open source, Scala-based load testing tool that allows for great customization and functionality. I.e. it can record your actual behaviour on the page and then translate it to code directly. Granted, the code might not be pretty, but it will get the job done and kickstart your scenario implementation.
An important choice to make is how you want the users to be flowing in the page. For example, do you want to inject 10,000 users at the same moment, or at randomized periods within 10 minutes until you reach the desired amount, or other methods.
For the first scenario we chose to inject the users at a constant rate by defining the target amount of users (30,000) and the period (600 seconds) which translates to 50 users every second.
For the second scenario, where you have to account for the fact that we are sending out emails, we adopted a similar approach. 30,000 users were injected by injecting 600 users per minute, even further splitting those 600 users to 20 users per second.
This simulates a steady flow of users considering that they have to
- Wait in the queue for their turn to come
- Receive the email
- Open the email and the containing link
3. Running the scenarios
For simple testing you can run the scenarios straight from your local machine, however it might not be powerful enough for 30,000 concurrent virtual users.
Because of this, for production testing we chose flood.io platform, which provides you with a very straightforward UI and enables you to start your scenarios with little to no friction. The downside — 15 hours of testing currently costs 100$. 15 hours is a lot if your tests are short, however you can run into some trouble if your tests are long and to be repeated multiple times.
It also supports Gatling and its Scala scripts without any issues.
Monitoring the application
It’s not enough to run the tests and see if they work. Even though flood.io provides you with a nice graph of transaction statistics, you still need to know what happened in your application on a deeper level.
For this we set up an elaborate Cloudwatch panel in AWS.

It contains several important statistics, such as
- CPU usage across all infrastructure (db reader/writer, redis, frontend, backend, sqs)
- FE/BE traffic
- DB traffic
- Load Balancer actions
- Requests per second
After all of this is set up, you are ready to launch the scenario. Keep your eyes peeled on the statistics panel. It’s an exciting process, especially when you can relax and prepare your infrastructure, instead of getting hit with this traffic and not being able to handle it.
Infrastructure setup
Initially our infrastructure consisted of the following basic parameters
- 8 c4.large front-end instances
- 2 db.r3.large Aurora MySQL instances, consisting of a writer and one reader
Results
When all of this is set up and the tests are launched, you can monitor your tools and evaluate the results.
Scenario one
First run
Here are the results of the first launch of the test — without changing anything in the infrastructure.
As you can see in this data, initial response time was 7 seconds, which then normalized during the test.
The peak transaction rate was 68k / minute.
Average response time was 1.15 seconds, which isn’t slow, but not near perfect either.
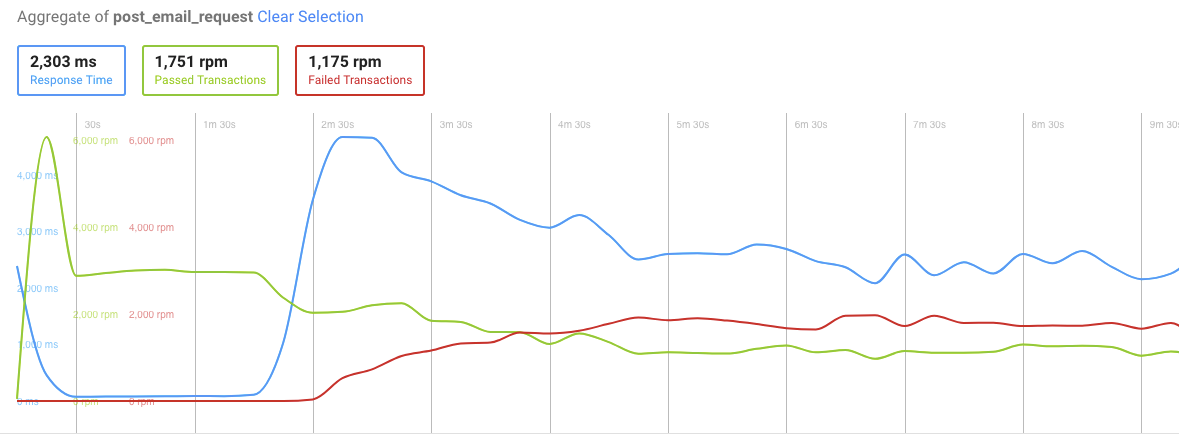
Let’s take a look at the failed transactions for the POST request of the first scenario (submitting the email):

You can see that transactions started failing right at the time when we hit peak request rates and around 10,000 concurrent users.
Result analysis
When you get these results, naturally the next step is investigation.
What we had to investigate was the dropping of transactions as well as the abnormal response times. Since we have Logstash set up, checking logs from multiple instances was a breeze.
What we did not pay much attention to was an external layer set up on the application — Cloudflare.
It turned out that Cloudflare’s attack protection kicked in and dropped the connections that seemed to be flooding the server intentionally, especially since those were coming from the same origin. And our goal was to determine the performance of the application and infrastructure, not taking into account third party throttling.
All we had to do was change the request base URL to bypass cloudflare — and directly hit the frontend auto-scaling group.
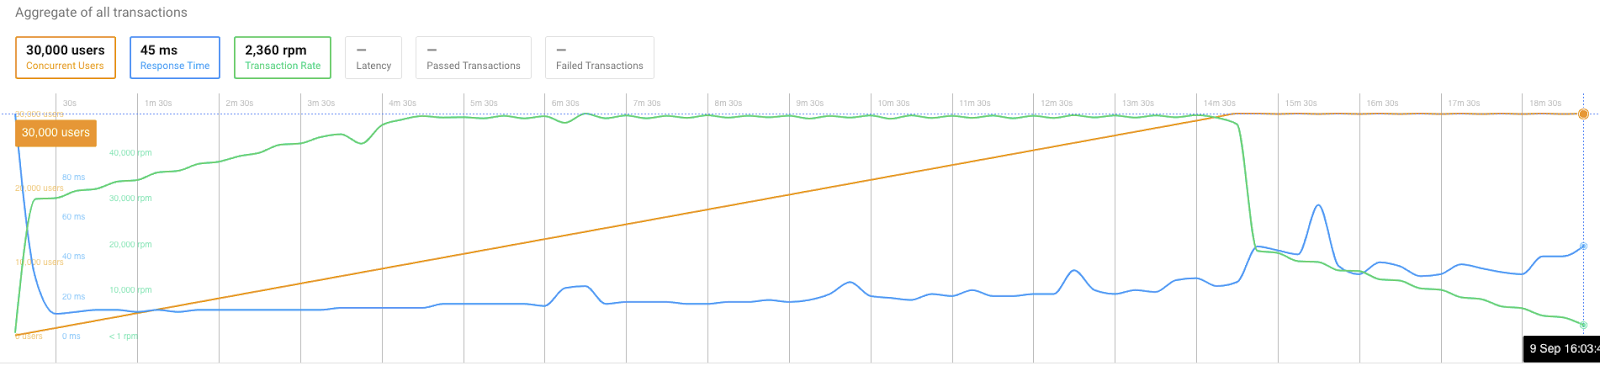
Second run
Here are the results after that was done:
As you can see, the failing transactions are still there, and response time jumped to 4 seconds after just 2 minutes of load testing.
Now, let’s take a look at some vital statistics on our AWS CloudWatch dashboard.
Everything looks nominal, except for this. The database peaked out at 100% CPU usage shortly after starting the test.
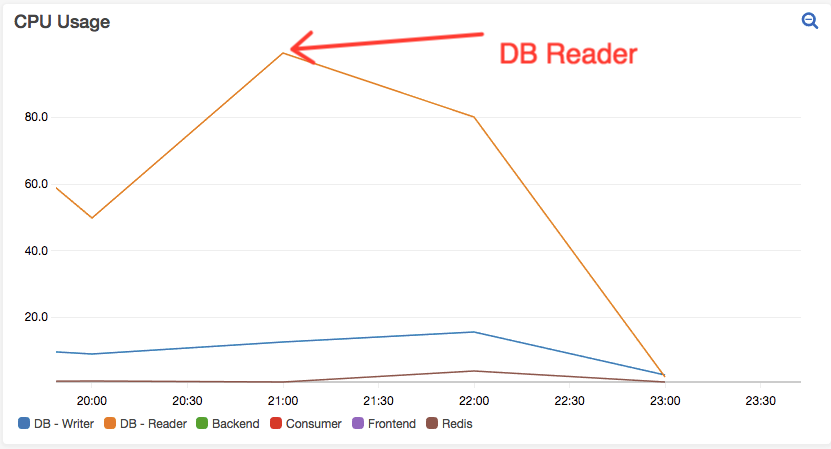
Result analysis
Second run was still far from perfect.
Cloudflare was eliminated as a request blocking element, however we were still left with a significant amount of users potentially being locked out.
When looking at the CPU usage of the database, the timing of max-out corresponded with the time when the transactions started failing and response time spiked.
Evidently, database was at fault, so we took the following actions:
- Revised the selects happening on the scenario. Nothing could be minified.
- Revised the database structure by checking if the table is indexed correctly. It is.
- Increased the minimum database count to 3 readers and 1 writer configuration.
Third run
After the database changes were applied, the test was launched again:
And the POST request statistics:
CPU usage:
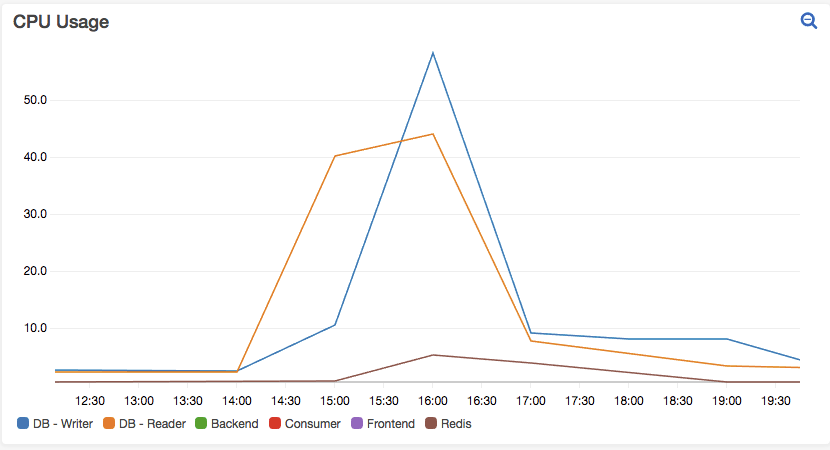
Result analysis
Now this looks a lot better! The response time has decreased to an average of 45ms.
But still, we are getting these failed transactions in POST request — around 120 in total, which still is not perfect.
Now it looks like CPU usage on the database instances is no longer the culprit, so we have to look elsewhere.
The logs were showing that creating PHP sockets failed. Which we attributed to exhausted open slots for connections. We decided to add more instances since that greatly increases the amount of open connections available.
Actions taken:
- Increased the minimum frontend instance count to 18
Fourth run
Pure joy:
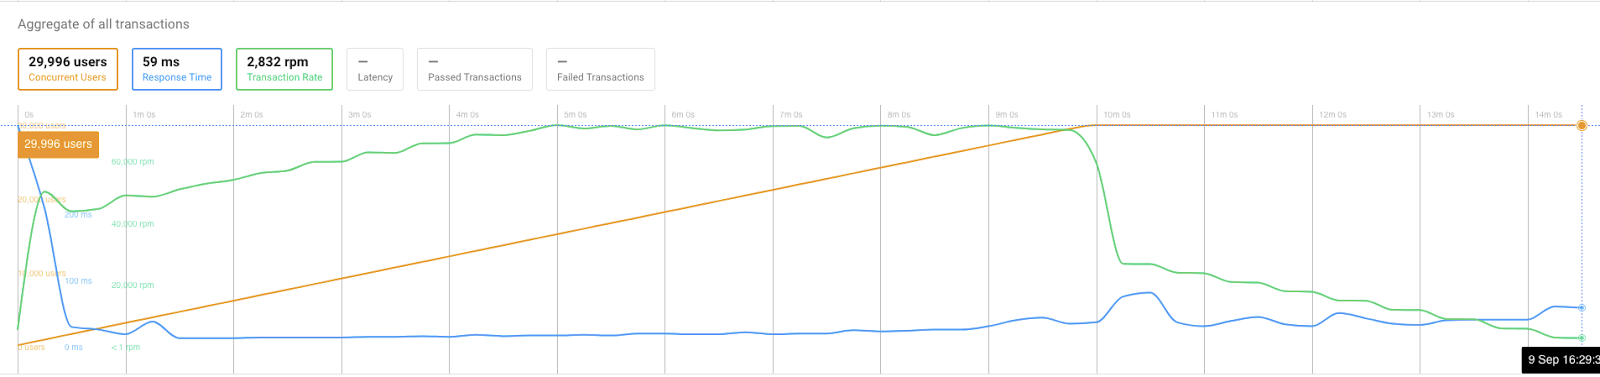
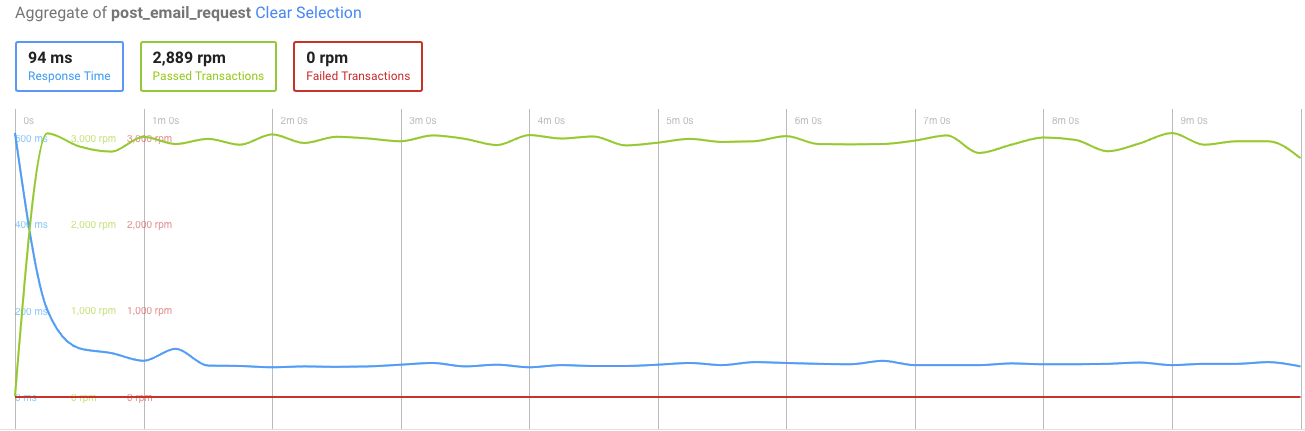
POST stats:
CPU usage:
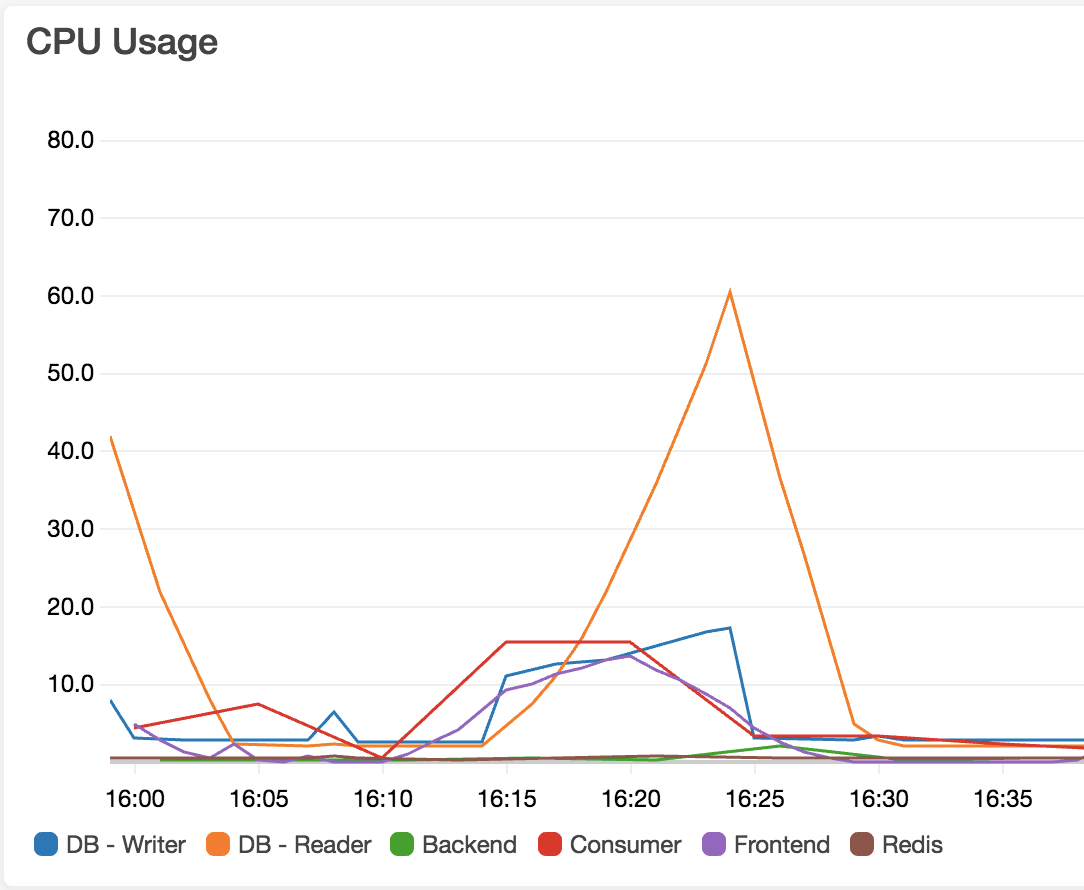
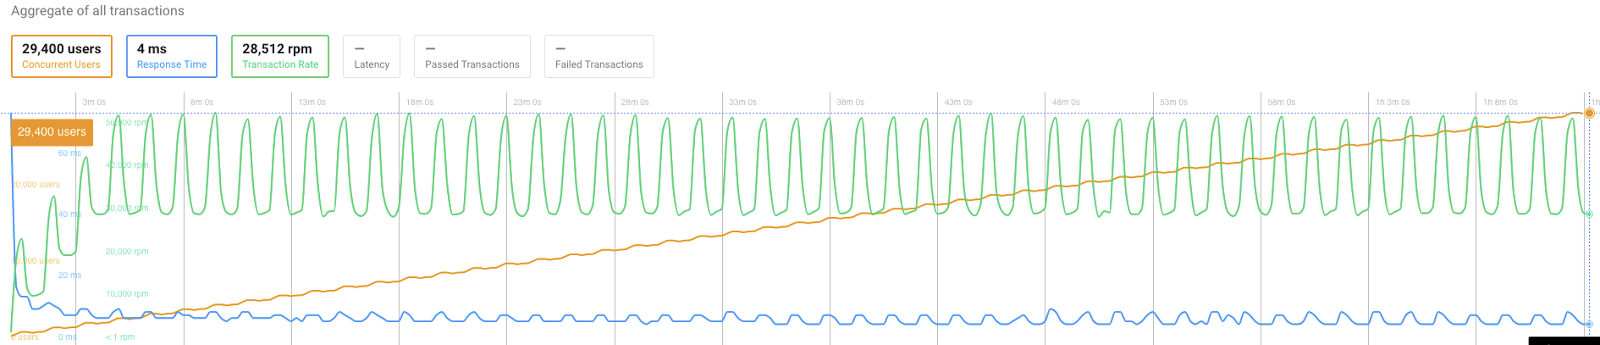
Result analysis
As we can see, 0 transactions failed in the POST request, as well as the overall average response time was improved by a few milliseconds.
30,000 concurrent user goal was reached! We dropped 0 connections and kept an amazing response time while doing so.
Conclusion
During these 4 major runs (there were lots of smaller runs outside the interest of this document), we determined the optimal server configuration and infrastructure setup to be able to effortlessly handle 30,000 concurrent users while keeping a great response time, averaging peaks of 45,000 requests per second.
Final infrastructure setup:
- 18 c4.large front-end instances
- 4 db.r3.xlarge Aurora MySQL instances, consisting of a writer and 3 readers
Scenario two
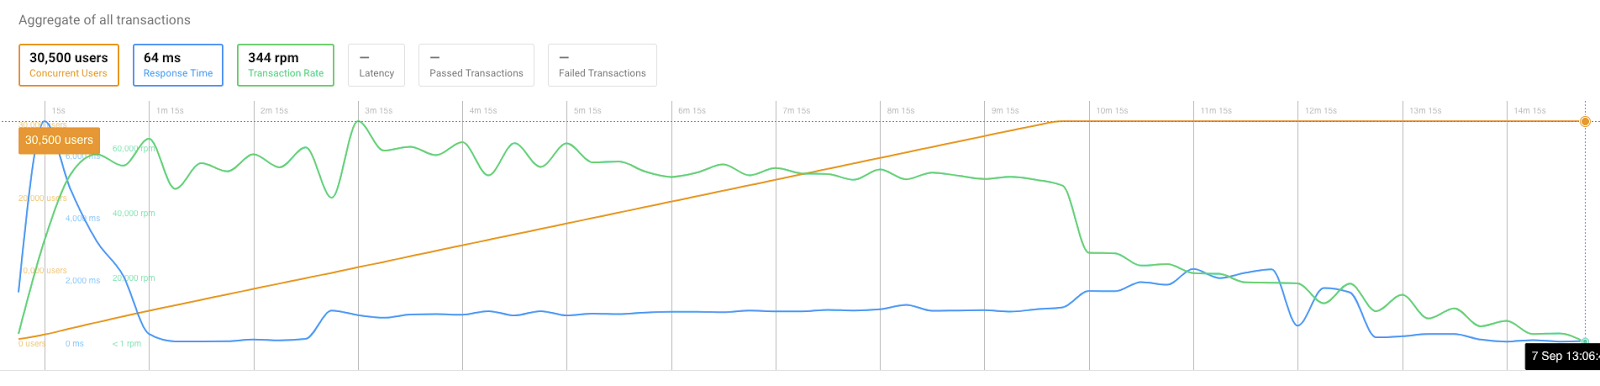
First run
Since we already determined the best setup for the first scenario, which is the most demanding on the infrastructure, we decided to simply launch the test without changing anything, and here are the results:
Overall transactions:

Due to the nature of the test scenario, the requests were noticeably periodic.
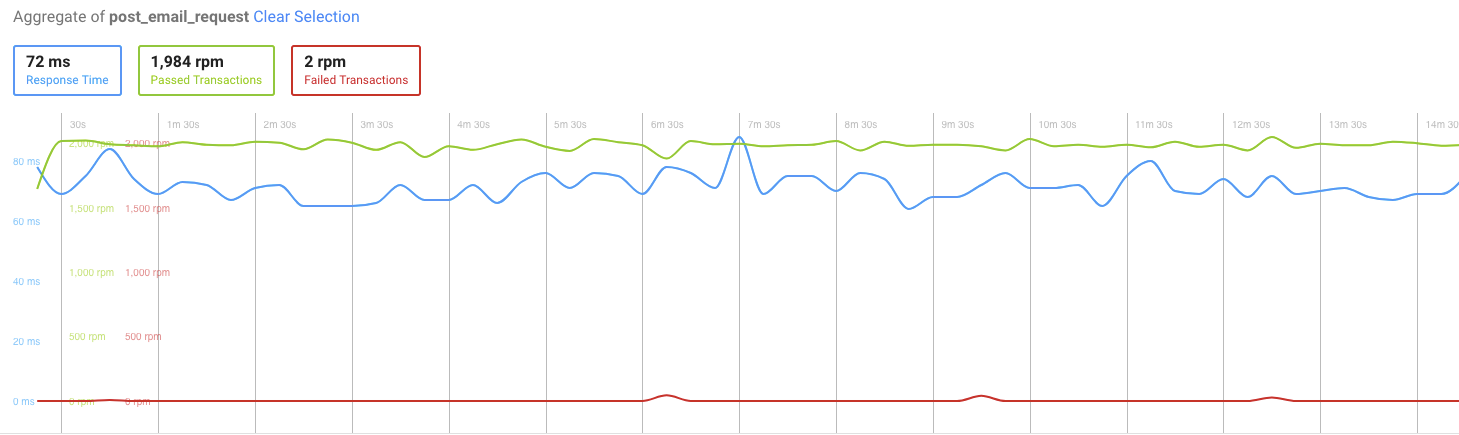
Submitting wallet information — generates most select/insert statements in the database:
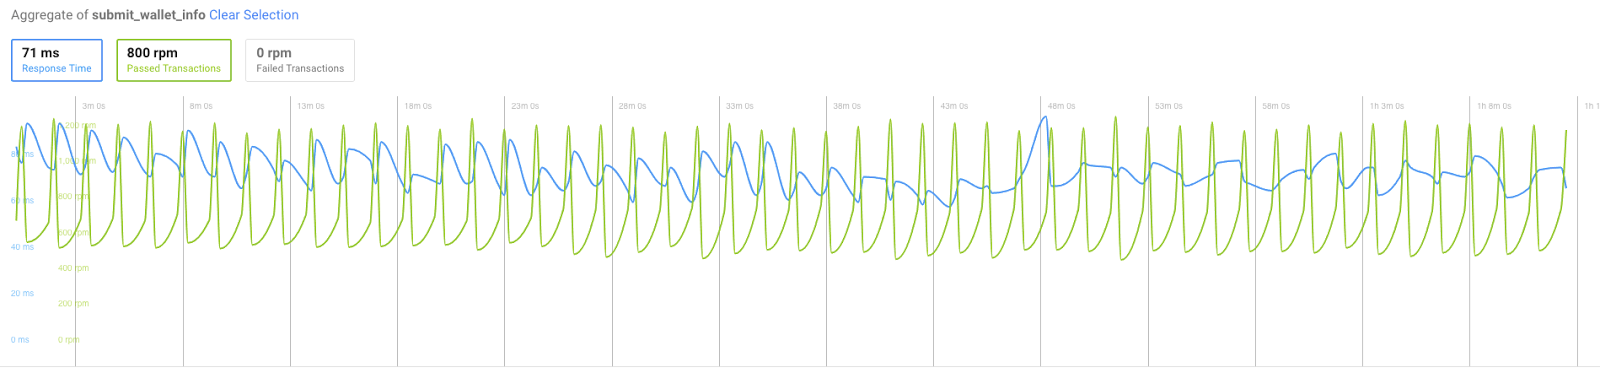
A good clear 0 failed transaction rate.
Conclusion
It was not surprising to see the test being passed on the first try, since we had already tweaked the infrastructure according to the most demanding part of the application.
Conclusion
It took a significant amount of time before even launching the first test, and the first test can be quite disappointing since you have no idea where to even start.
However, after several tries, experimentation and deep investigation it is possible to scale to any desired goal.
It took us 4 major tries to come to a point where we can handle 30,000 concurrent users without any noticeable performance degradation or even just locking users out.
Real life application performance
As stated in the beginning of the article, our expected load was 30,000 concurrent users interacting with the application which resulted in 45,000 requests per second at most.
However in the actual go-live day peak requests per second reached only a bit over 18,000.
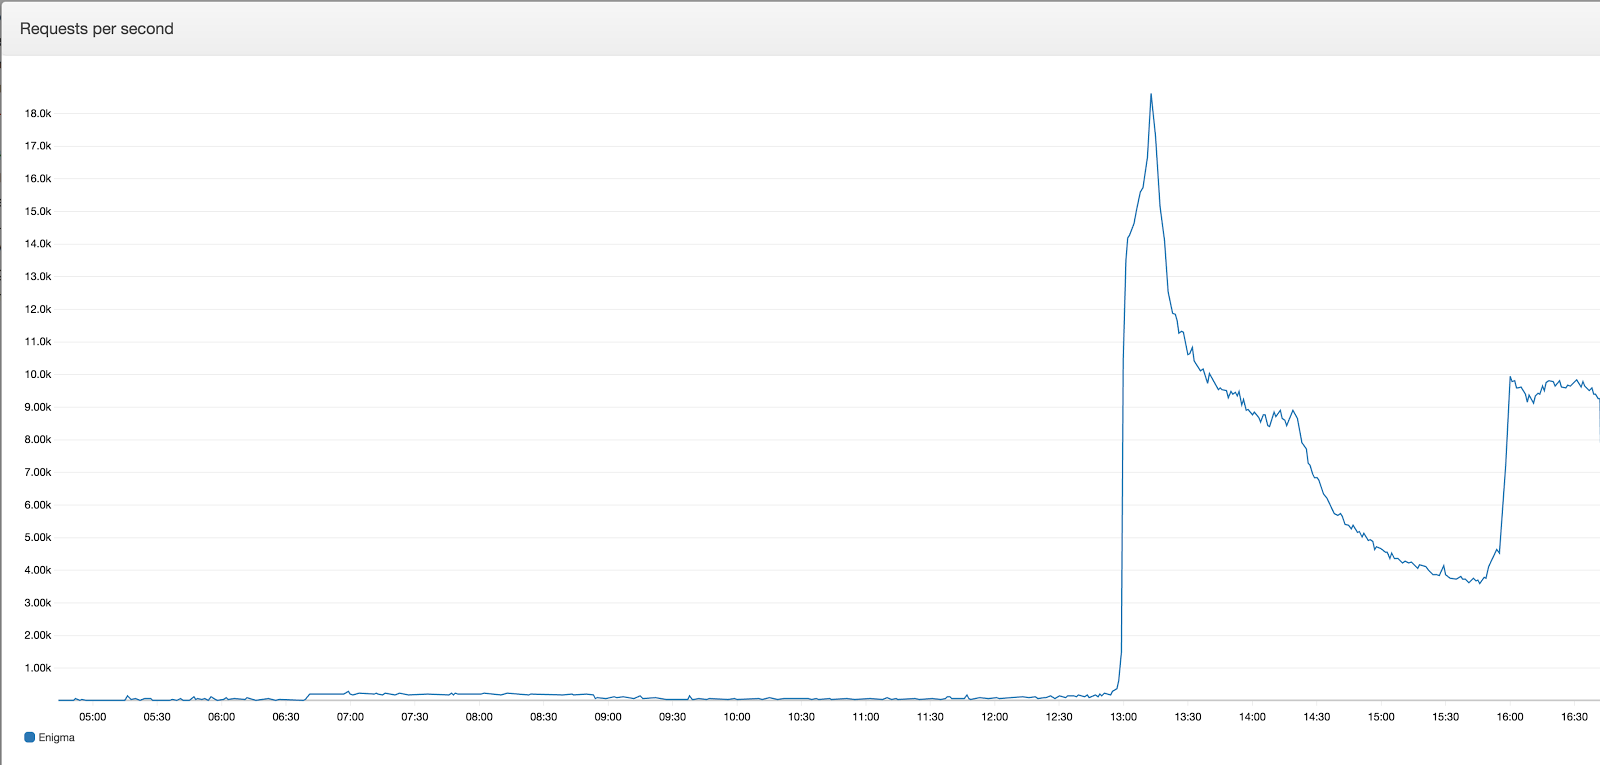
And since we had prepared the environment for twice or triple the load, 0 issues were experienced and reported.
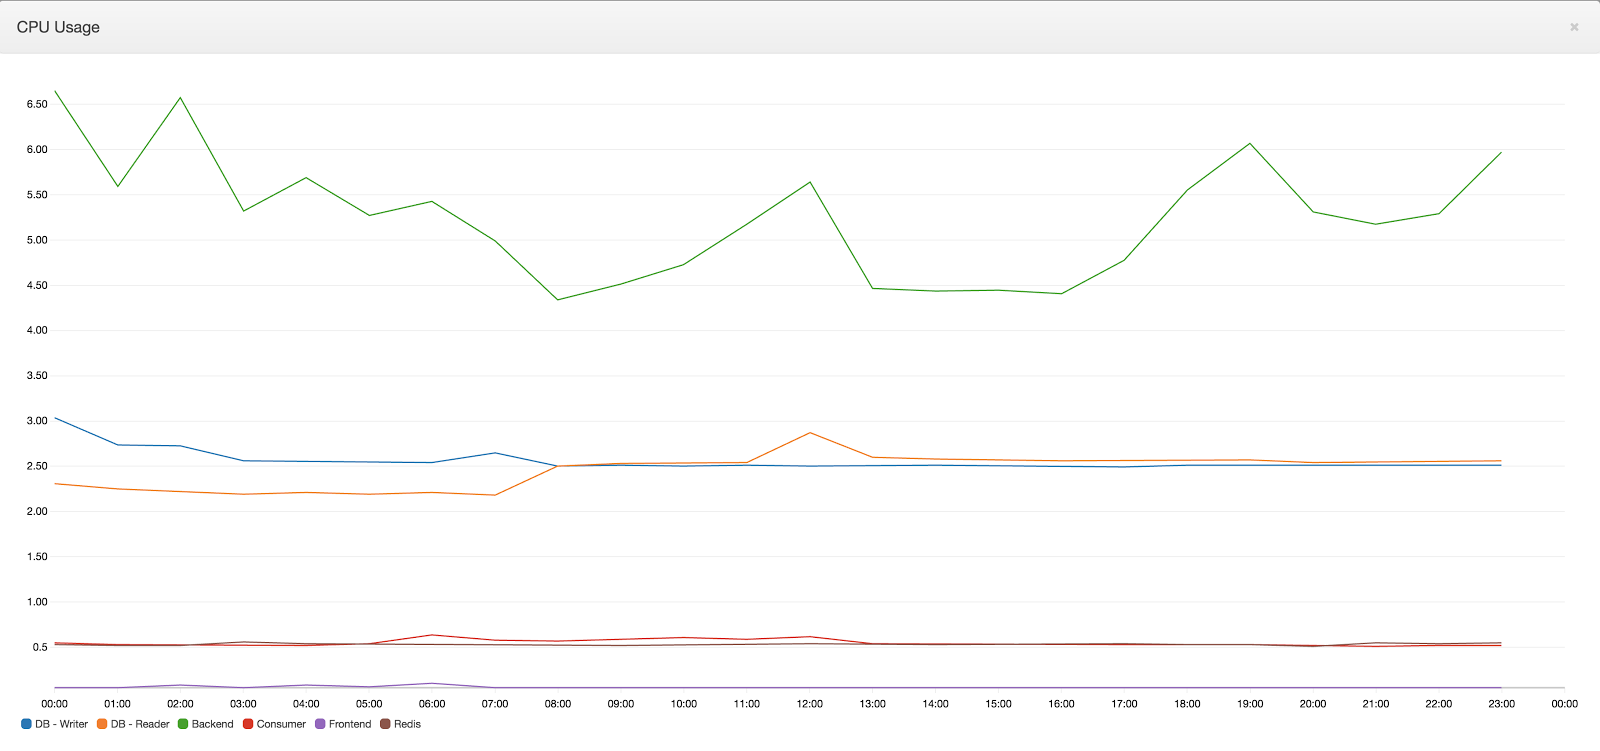
Also, since Cloudflare was used and several assets were served from it, the actual load on the front-end server decreased:
In conclusion, we can safely say that our load test was successful and that it contributed in scaling the application to and beyond expected loads.
We hope that you have enjoyed reading our case study. Stay tuned — more case studies are coming!

Share on: